Best Trading Indicators for 2025 — How to Stack Them for High-Probability Trades
Jul 13, 2025
Best Indicators for Trading (And Why One Indicator Isn’t Enough)
New traders love to search for the “perfect” indicator — the one tool that solves every trade, every market condition, every decision.
The reality? That tool doesn’t exist.
The right indicator depends on:
✔️ The market condition
✔️ The timeframe
✔️ The type of trade you’re taking
The traders who consistently win?
They understand no single indicator works in isolation.
Confluence — multiple tools confirming each other across multiple timeframes — is how real high-probability trades happen.
This is exactly how I trade, and exactly how I designed tools like SwingTraderPro and ORBI — combining indicators, structure, and trend analysis to stack the odds in your favor.
Let’s break down some of the best indicators for trading, how they actually work, and how they fit into a system designed for precision.
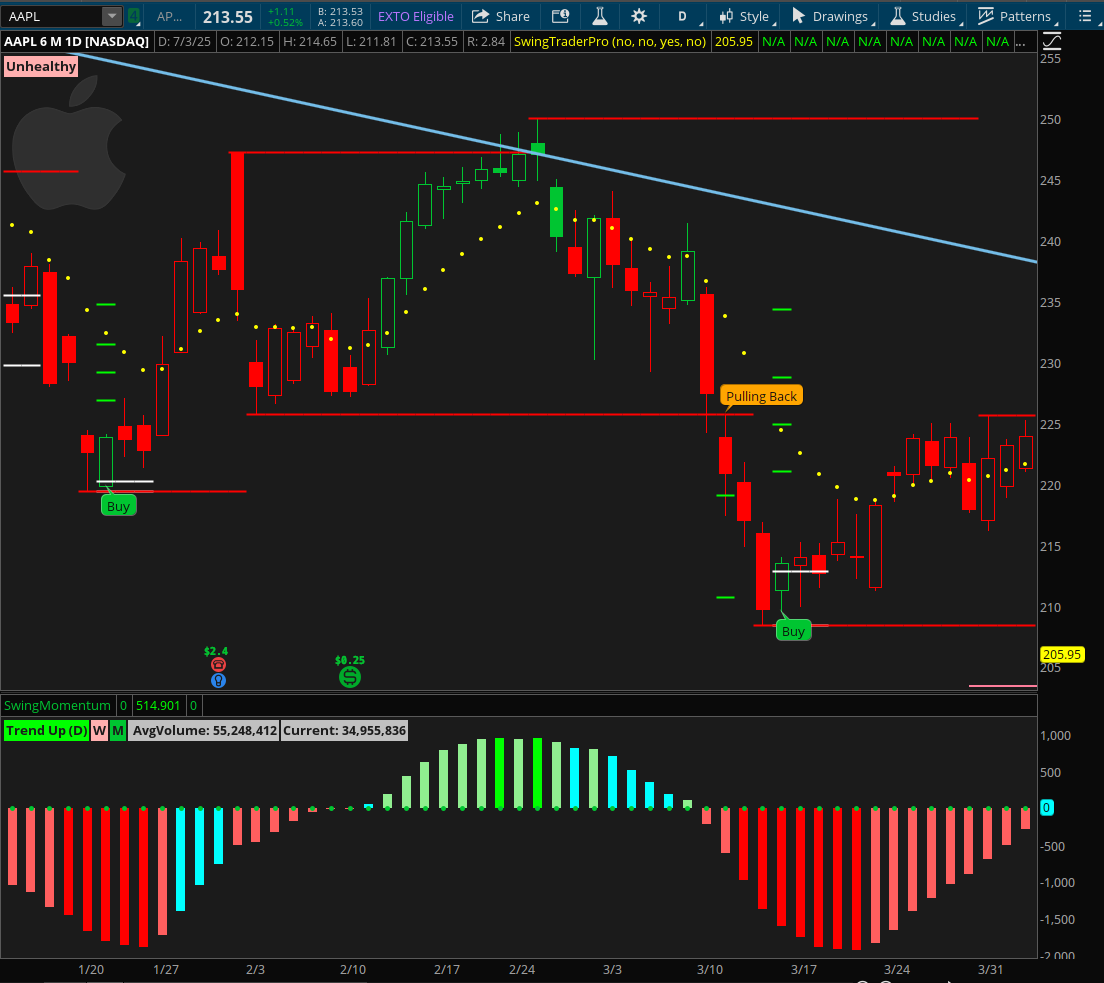
1️⃣ Trend Indicators — Defining Market Direction with SMAs
Long-term SMAs (50, 100, 200) help traders:
✔️ Understand overall market health
✔️ Identify healthy, stacked trends
✔️ Avoid chop and false breakouts
But a single SMA alone? Can mislead.
It’s the alignment that matters:
-
50 > 100 > 200 = Very Healthy — positioned for new highs
-
50 < 100 < 200 = Unhealthy — prone to downside continuation
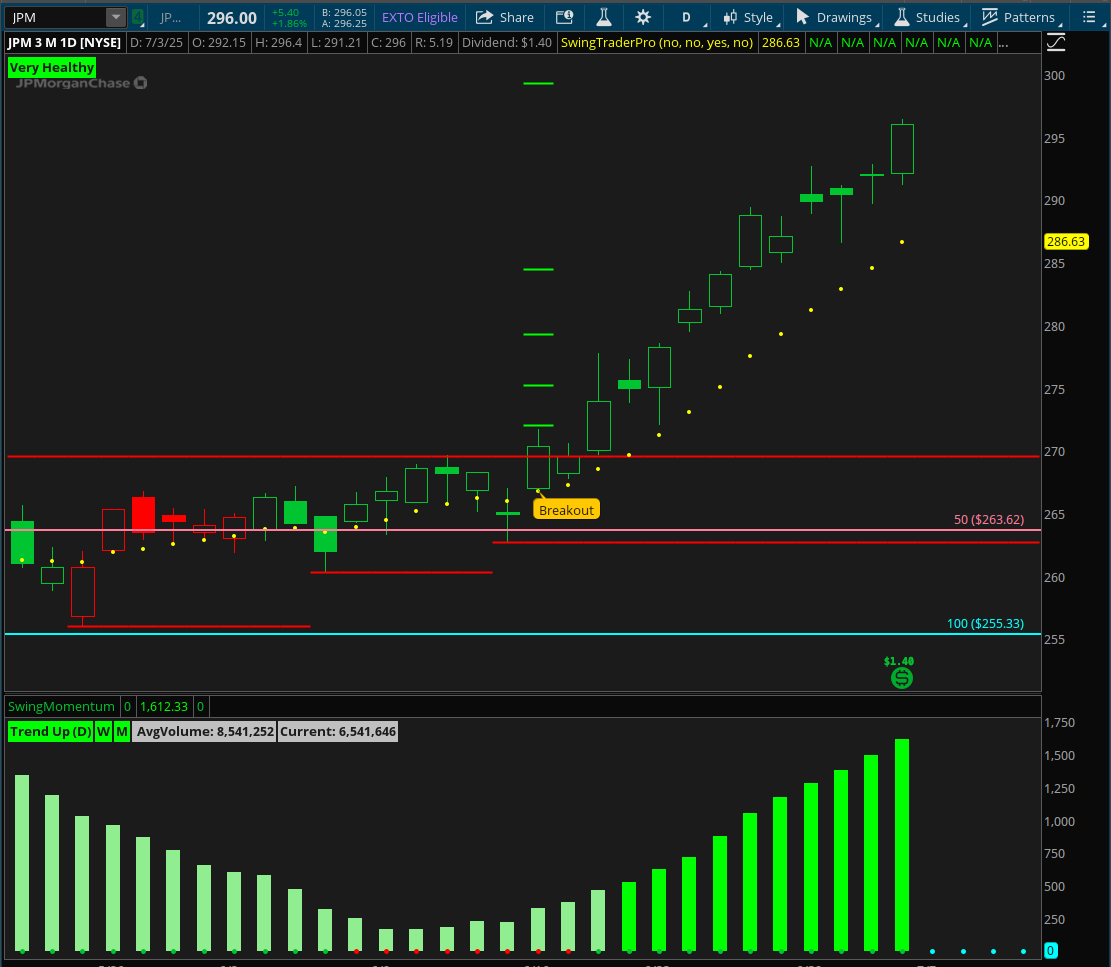
Trading with trend confirmation means filtering out the noise before it costs you.
2️⃣ Momentum Indicators — Spotting Shifts with MACD
MACD visualizes near-term momentum strength:
✔️ MACD line above 0 = Uptrend
✔️ MACD cross above 0 = Strong, sustained bullish momentum
✔️ MACD line below 0 = Downtrend
✔️ MACD cross below 0 = Bearish confirmation
MACD alone gives insight — but paired with other tools, its predictive power improves dramatically.
This is why MACD plays a role in my systems, but never functions solo — confluence builds the edge.
3️⃣ Exhaustion Indicators — Finding Reversals with RSI & Bollinger Bands
RSI:
✔️ Overbought/oversold zones show potential exhaustion
✔️ Best used with context — not all extremes are valid reversals
Bollinger Bands (BB):
✔️ Visualize price extremes and volatility compression
✔️ Help spot expansion phases and market exhaustion
RSI + BB together increase reversal confidence — but again, no guarantees alone.
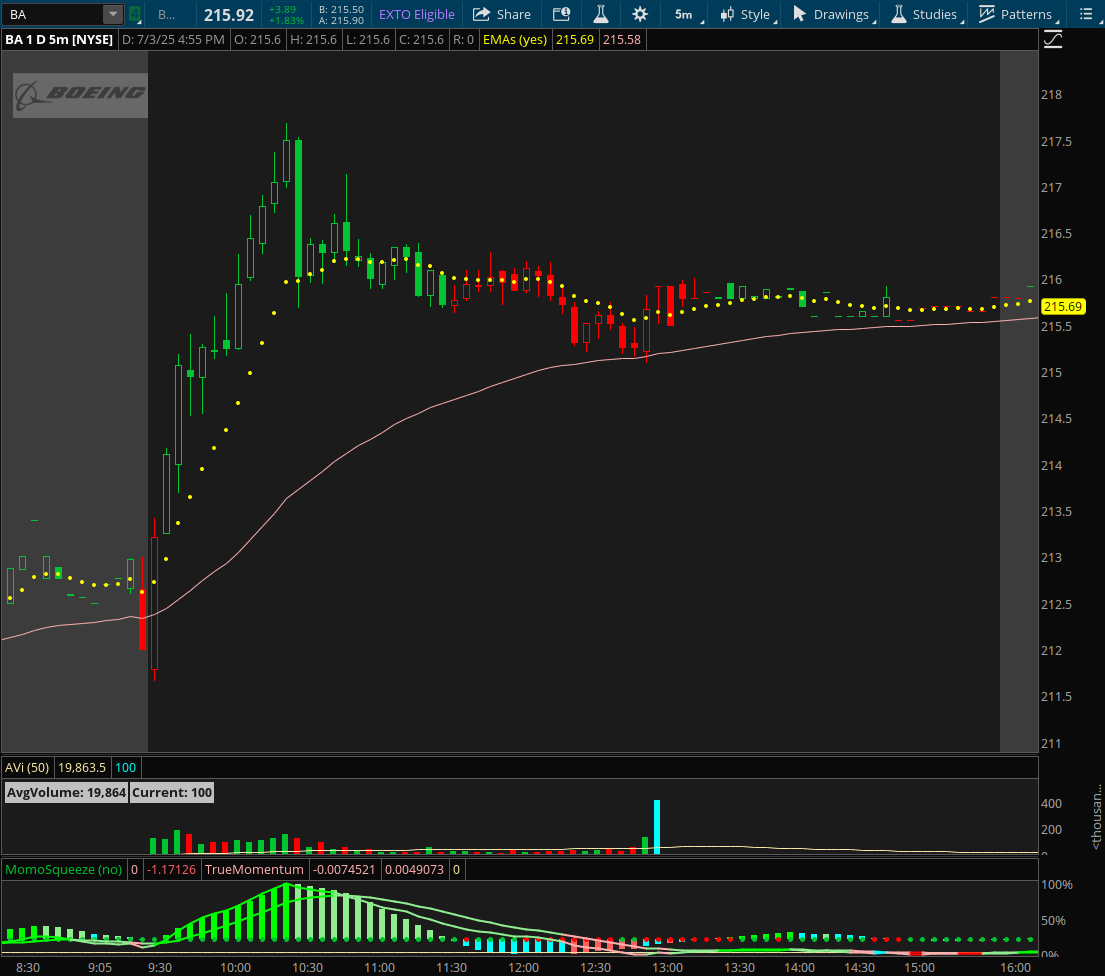
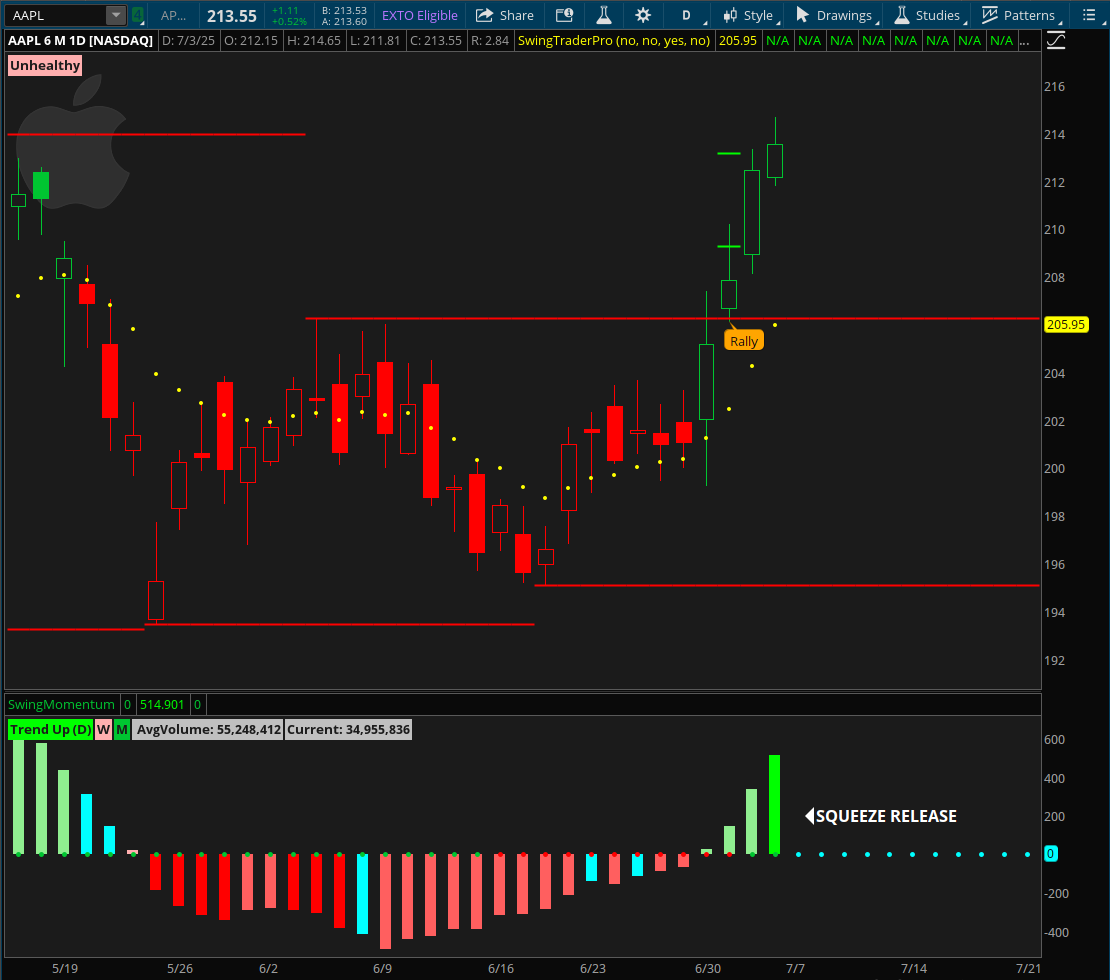
4️⃣ Breakout Indicators — Anticipating Big Moves with the TTM Squeeze
TTM Squeeze:
✔️ Identifies volatility compression
✔️ Predicts breakout potential — but direction still needs confirmation
MACD + Squeeze = powerful breakout filter when aligned with structure.
5️⃣ Confluence — Why One Indicator Isn’t Enough
Most indicators on their own have disappointing long-term win rates:
-
MACD crosses? Around 30% effective on a single timeframe
-
RSI overbought/oversold extremes? Similar low standalone success
This is where confluence comes in:
✔️ Multiple indicators stacked together
✔️ Multi-timeframe alignment
✔️ Trend structure confirmation
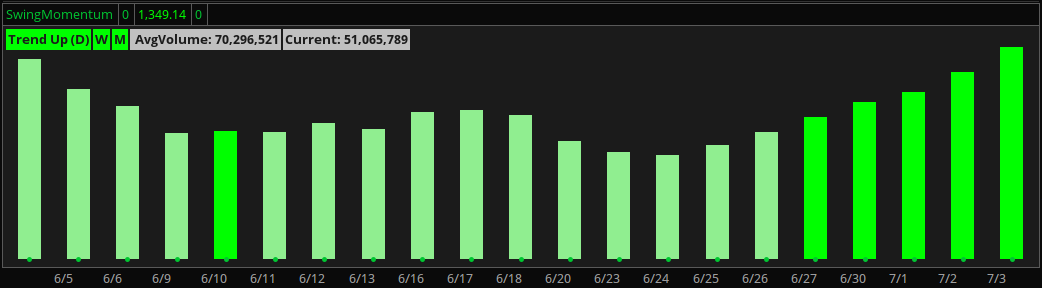
SwingTraderPro and ORBI automate that process:
-
MTF analysis
-
Indicator stacking
-
Structure validation
The result?
-
SwingTraderPro: 89% win rate over years of trades — because it stacks the odds
-
ORBI: High-probability day trade signals filtered for structure and trend
No single indicator is the magic solution — but stacking indicators, filtering trends, and applying structure gets you close.
That’s why I built these tools — to deliver the high-probability precision most traders chase, without the guesswork.
🎯 The Best Indicator is the One That Stacks the Odds
New traders chase “the one.”
Experienced traders stack edges with structure, confluence, and risk management.
That’s exactly what SwingTraderPro and ORBI do — automating the multi-indicator, multi-timeframe approach required for real trade precision.
If you’re ready to stop guessing and start using the tools that actually stack the odds:
👉 See How SwingTraderPro and ORBI Find High-Probability Trades
Learn The Strategy
Learn the exact momentum strategy that simplifies structure, timing, and trade execution—so you can trade with clarity in under 30 minutes a day.
📩 Want to Receive the Weekly Market Analysis Every Sunday?
Stay ahead of the trends with expert insights, key levels, and trade opportunities for the week ahead.
We hate SPAM. We will never sell your information, for any reason.
