How to Perform Multi-Timeframe (MTF) Analysis on SPY Like a Pro
Jun 05, 2025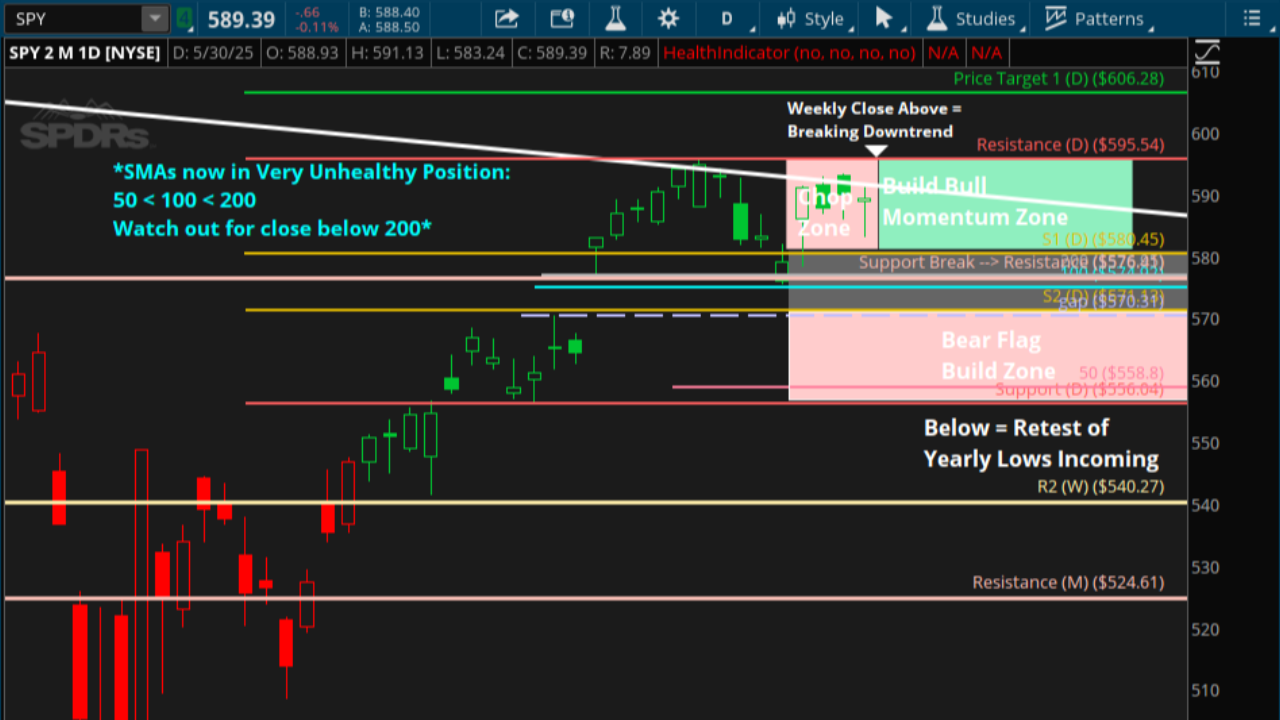
How to Read SPY Price Action Like a Pro
Most traders look at price action. Few know how to read it.
If you’ve ever been trapped in chop, mistimed a breakout, or felt the market “faked you out,” it’s likely because you were reacting instead of reading. When you master MTF (Multi-Timeframe) analysis and combine it with clear technical strategies, SPY’s price action starts making complete sense.
Let’s break down exactly how to read SPY like a professional trader—with real-world examples, actionable steps, and zero fluff.
🧠 Step 1: Understanding MTF (Multi-Timeframe) Analysis for SPY Trading
Multi-Timeframe (MTF) analysis means evaluating SPY's price action across multiple timeframes to get a clearer picture of market direction:
-
Monthly charts: Reveal the bigger market bias, trend shifts, and significant institutional-level positioning.
-
Weekly charts: Clarify weekly momentum, resistance, and support zones.
-
Daily charts: Provide precise entry, exit, and pattern recognition.
This holistic view eliminates guesswork, giving you an institutional-grade perspective.
🔍 Keywords: SPY ETF, SPY technical analysis, SPY support and resistance.
📈 Step 2: Monthly and Weekly Charts Guide Your Market Bias
Every month, I analyze the SPY monthly candle to identify key signals:
-
Candle patterns: Bullish/bearish engulfing, topping tails, bottoming tails.
-
Indicators: RSI shifts (overbought/oversold), MACD crossovers.
-
EMA/SMA crossovers: Critical signals for long-term trend changes.
Weekly charts then give context for the month ahead:
-
Did we close bullish (at highs) or bearish (at lows)?
-
Are we stuck in consolidation or moving into breakout zones?
These weekly closes help predict market sentiment for the coming trading week.
📊 Step 3: Daily Charts — The Ultimate Roadmap for SPY Trades
While the monthly chart defines bias and the weekly chart confirms direction, the daily chart is where the real work happens. This is your roadmap for precision trading—the time frame where you identify:
-
Entries and exits
-
Breakout and breakdown zones
-
Price action patterns and momentum shifts
-
Key technical indicators like SMAs, RSI, and MACD
Here’s how pros break it down:
🔺 Key Patterns to Watch on the Daily Chart
🔹 Bullish and Bearish Flags (Using Fibonacci Levels)
-
Start with the trend: Identify a move with clear higher highs and higher lows (uptrend) or lower highs and lower lows (downtrend)
-
Draw your Fib retracement: Measure from the trend high to the trend low (or vice versa)
-
Confirm continuation:
-
As long as price stays above the 38.2% retracement (in an uptrend), bulls still control the structure.
-
If price dips below 61.8%, be cautious—the trend is likely weakening.
-
Breakouts become real once price clears the 100% level and moves toward 127% and 161.8% extensions.
🔹 SMA Positioning Patterns
-
Strong Bullish Structure: 50 > 100 > 200
-
Strong Bearish Structure: 50 < 100 < 200
-
These stacks are momentum trading cheat codes. They help you identify which tickers are leading the market.
📌 Pro Tip: Never trade a breakout until price is above the 50 SMA.
Never trade a breakdown until price is below the 50 SMA.
Anything inside the 0–100% retracement and stuck between SMAs? That’s chop. Avoid it.
🔍 Keywords: SPY RSI, SPY VWAP, breakout trading, momentum trading strategy, SPY support and resistance.
📊 Step 4: Real-World Example — PLTR Weekly Roadmap Follow-Through
Let’s talk about PLTR — a perfect case study from our weekly watchlist.
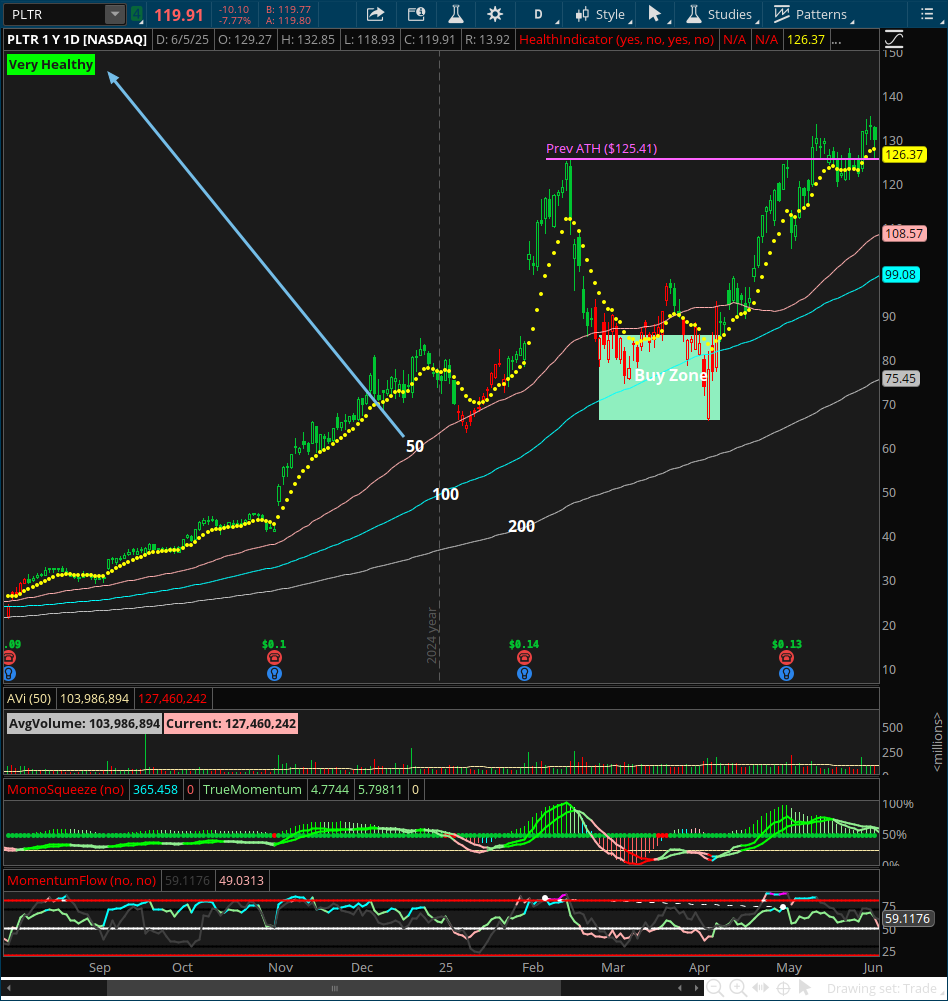
Back in early 2025, PLTR had one of the strongest SMA stacks in the market: 50 > 100 > 200 on the daily and weekly charts. Even during its pullback from $125 to $66, the long-term trend structure remained intact. We flagged this repeatedly in our weekly watchlist for our readers: this wasn’t a breakdown — it was a buy-the-dip opportunity in a leading ticker.
Fast forward two months: PLTR surged to new all-time highs at $135.
Following these rules during market pullbacks keeps you positioned in the right stocks — before the breakout.
📚 SPY Price Action FAQs
Q: What is the best timeframe for trading SPY options?
The daily chart provides the clearest setups for SPY options trades, especially when paired with strong MTF alignment.
Q: How do I avoid SPY chop zones?
Avoid trading breakouts that haven’t cleared the 50 SMA. And skip anything caught between Fib retracement levels inside a tight structure.
Q: What are the best technical indicators for SPY momentum trading?
-
RSI and MACD for momentum shifts
-
VWAP and volume analysis for confirming breakouts
-
SMA stacks to confirm directional trend strength
Q: How do I find the strongest SPY-related tickers?
Look for tickers with 50 > 100 > 200 structure on the daily and weekly charts. These are your high-probability trend leaders.
📌 Quick Takeaways – SPY Price Action Cheat Sheet
-
Use Monthly chart for long-term bias
-
Use Weekly chart to confirm directional setup
-
Use Daily chart to time entries, exits, and pattern continuations
-
Trade breakouts above the 50 SMA, breakdowns below — skip chop zones
-
Follow SMA stacking (50 > 100 > 200) for bullish momentum leaders
-
Use Fibonacci retracements to track and validate trend continuation
🎯 Ready to Trade SPY with Structure and Confidence?
If today’s walkthrough gave you clarity, this is just the beginning.
In the Momentum Mastery Webinar, you’ll learn:
✅ The 3 Keys to mastering momentum — how to follow trend, find structure, and trade with timing
✅ How to read SPY like a quant — using price action, EMAs, and momentum indicators to stay ahead of the move
✅ Why multi-timeframe alignment is the edge pros use — and how to spot it before breakout
✅ The exact framework I built for myself to trade options logically, consistently, and without second-guessing
You’ll also see how SwingTraderPro applies this framework in real time:
-
It confirms signals only at the close (no intrabar guessing)
-
It filters for high-probability setups based on trend, structure, and momentum
-
And it’s delivered a verified 89% win rate across over 460 swing trades since 2020
🗓️ Plus, every week I send a detailed SPY Roadmap to all subscribers — covering:
-
Monthly, weekly, and daily timeframe breakdowns
-
Key SPY support/resistance levels
-
Bullish and bearish game plans
-
A curated list of tickers with optimal SMA positioning (50 > 100 > 200)
-
Clear signals on when to wait… and when to strike
If you’re serious about upgrading your strategy and eliminating guesswork, this is the next step.
👉 Watch the Free Webinar + Get the Weekly SPY Roadmap
Learn The Strategy
Learn the exact momentum strategy that simplifies structure, timing, and trade execution—so you can trade with clarity in under 30 minutes a day.
📩 Want to Receive the Weekly Market Analysis Every Sunday?
Stay ahead of the trends with expert insights, key levels, and trade opportunities for the week ahead.
We hate SPAM. We will never sell your information, for any reason.
