SPY Pulls Back From ATHs as Momentum Slips — A Critical Decision Point
Dec 14, 2025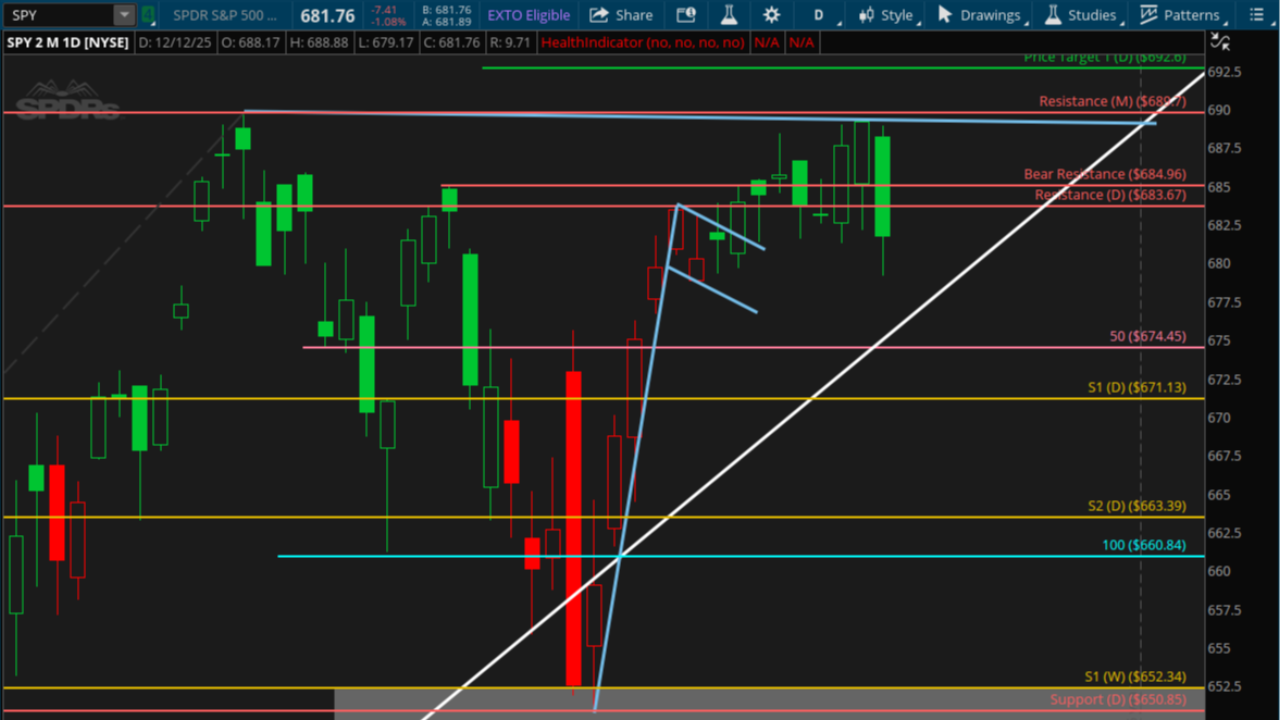
📊 Daily Market Analysis (SPY — Daily Chart)
On the daily timeframe, the sequence becomes much clearer.
Last Friday’s spinning top failed to break above all-time high resistance at 689.7, signaling hesitation right where bulls needed continuation.
What Happened Next
-
Monday: Price pulled back to test the breakout level above former bull flag resistance at 683.67
-
Tuesday–Wednesday: SPY chopped sideways, repeatedly testing that level as support
-
Thursday: Bulls finally pushed higher and closed strong
-
Friday: That strength failed — price sold off hard and broke the short-term uptrend
That Friday selloff is the key development.
The market didn’t just pull back — it lost momentum at the highs and broke trend structure, signaling that buyers are starting to lose control at this level.
🧭 Where That Leaves Us Now
Bulls may need more fuel before another push higher — but the window to regain control is narrowing.
The most logical area for buyers to step back in is a pullback toward:
-
The 50 SMA (Daily)
-
Newly established bull flag support
A controlled pullback into that zone would be constructive. It would allow momentum to reset, structure to rebuild, and give bulls a chance to reload for another attempt higher.
However, this is no longer a low-risk breakout environment.
⏱️ Bulls Are Running Out of Time
It’s important to note that bulls can still restart upward momentum from here, but they need confirmation soon.
From here forward, the key tells will be momentum-based, not price alone:
-
Daily MACD
-
TTM Squeeze
If MACD rolls over and the squeeze fires to the downside, that would confirm that this pullback is transitioning into a deeper corrective or consolidation phase.
On the other hand, if MACD holds, the squeeze remains contained, and price attempts another breakout, the market could still make it to new highs on the next push.
⚠️ There’s a Line in the Sand
If price fails to hold the 50 SMA / bull flag support:
-
The weekly uptrend would begin to break
-
Volatility would likely increase
-
A broader consolidation phase could unfold over the coming weeks to months
That scenario would shift the environment from trend continuation to range management.
🎯 Bottom Line
-
The attempted breakout failed at ATH resistance
-
Daily trend structure has broken
-
Bulls are losing control at the highs, not at support
The next move depends entirely on how price reacts to the next pullback — and how momentum confirms it.
Either:
-
Buyers defend the 50 SMA / bull flag support and reload for another push
or -
Support fails and the market transitions into a higher-volatility consolidation phase
After weeks of chop and compression, this is a true inflection point.
Let price show its hand — structure first, momentum confirmation second.
Learn The Strategy
Learn the exact momentum strategy that simplifies structure, timing, and trade execution—so you can trade with clarity in under 30 minutes a day.
📩 Want to Receive the Weekly Market Analysis Every Sunday?
Stay ahead of the trends with expert insights, key levels, and trade opportunities for the week ahead.
We hate SPAM. We will never sell your information, for any reason.
